| Matplotlib | |
|---|---|
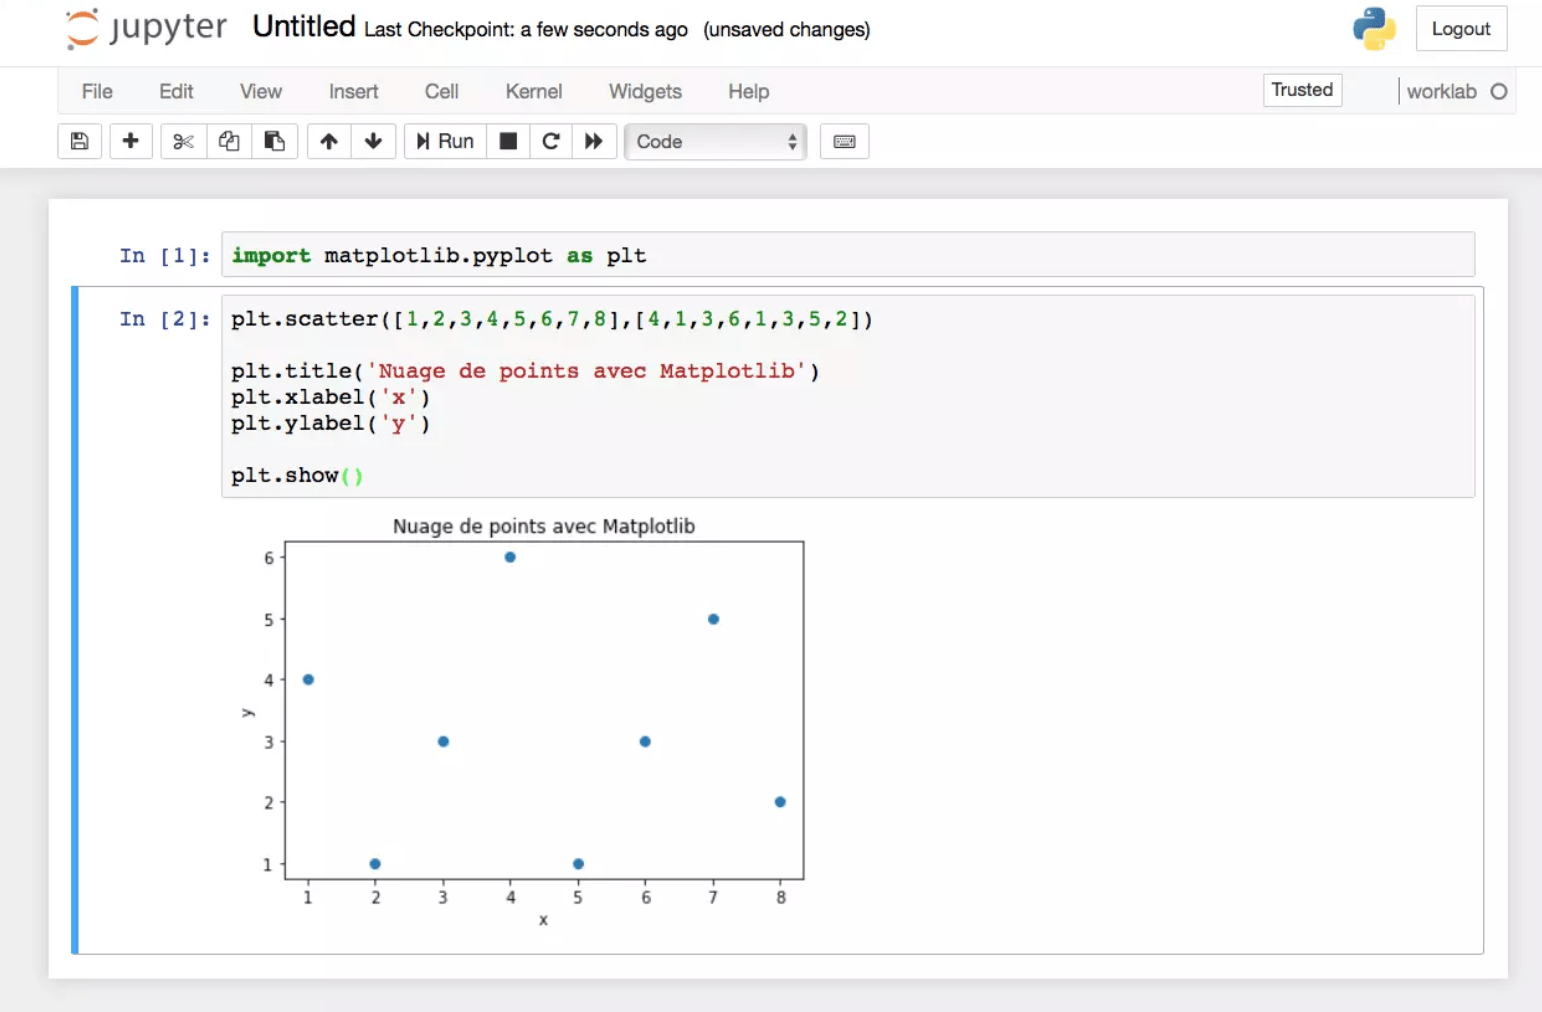
 Screenshot of Matplotlib plots and code | |
| Original author | John D. Hunter |
| Developers | Michael Droettboom, et al. |
| Initial release | 2003[1] |
| Stable release | 3.11.0[2] |
| Written in | Python |
| Engine | Cairo, Anti-Grain Geometry |
| Operating system | Cross-platform |
| Type | Plotting |
| License | Matplotlib license |
| Website | matplotlib |
| Repository | |
Matplotlib (portmanteau of MATLAB, plot, and library[3]) is a plotting library for the Python programming language and its numerical mathematics extension NumPy. It provides an object-oriented API for embedding plots into applications using general-purpose GUI toolkits like Tkinter, wxPython, Qt, or GTK. There is also a procedural "pylab" interface based on a state machine (like OpenGL), designed to closely resemble that of MATLAB, though its use is discouraged.[4] SciPy makes use of Matplotlib.
Matplotlib was originally written by John D. Hunter. Since then it has had an active development community[5] and is distributed under a BSD-style license. Michael Droettboom was nominated as Matplotlib's lead developer shortly before John Hunter's death in August 2012[6] and was further joined by Thomas Caswell.[7][8] Matplotlib is a NumFOCUS fiscally sponsored project.[9]
Usage
editMatplotlib is used in scientific research as a tool for data visualization. For example, the Event Horizon Telescope collaboration used Matplotlib to produce visualizations during the effort to create the first image of a black hole.[10] Matplotlib also underpins the plotting functionality of many scientific Python libraries (for instance, pandas uses Matplotlib as its default backend for plotting). Its importance to the scientific community has been acknowledged by institutions such as NASA, which in 2024 awarded a grant to support Matplotlib’s continued development as part of an initiative to fund widely used open-source scientific software.[11]
In education and data science, Matplotlib is frequently used to teach programming and data visualization. It integrates with Jupyter Notebook, allowing students and instructors to generate inline plots and interactively explore data within a notebook environment.[12] Many educational institutions incorporate Matplotlib into their curricula for teaching STEM concepts,[13] and it is widely featured in tutorials, workshops, and open online courses as a primary plotting library.
Related projects
edit- DISLIN
- GNU Octave
- Plotly – for interactive, online Matplotlib and Python graphs
- PLplot – Python bindings available
- SageMath – uses
Matplotlibto draw plots
See also
editReferences
edit- ^ "Copyright Policy".
- ^ "Release 3.11.0". 12 June 2026. Retrieved 12 June 2026.
- ^ "History — Matplotlib 3.9.2 documentation".
- ^ "API Overview". matplotlib.org.
- ^ "Matplotlib github stats". matplotlib.org.
- ^ "Announcing Michael Droettboom as the lead Matplotlib developer". matplotlib.org. Archived from the original on 2020-10-27. Retrieved 2013-04-24.
- ^ "Matplotlib Lead Developer Explains Why He Can't Fix the Docs—But You Can – NumFOCUS". NumFOCUS. 2017-10-05. Retrieved 2018-04-11.
- ^ "Credits – Matplotlib 2.2.2 documentation". matplotlib.org. Retrieved 2018-04-11.
- ^ "NumFOCUS Sponsored Projects". NumFOCUS. Retrieved 2021-10-25.
- ^ "Case Study: First Image of a Black Hole". NumPy. Retrieved 22 April 2025.
- ^ "NASA Funds Open-Source Software Underpinning Scientific Innovation". NASA. Retrieved 22 April 2025.
- ^ "Interactive notebooks: Sharing the code". Nature. 18 September 2018. Retrieved 22 April 2025.
- ^ "Pyplot tutorial". Matplotlib. Retrieved 22 April 2025.
