| Matplotlib
| |
|---|---|
 Eine Zusammenstellung aus fertigen Graphen und dem dazugehörigen Programmcode. | |
| Basisdaten
| |
| Entwickler | John D. Hunter |
| Erscheinungsjahr | 2003[1] |
| Aktuelle Version | 3.11.0[2] (12. Juni 2026) |
| Betriebssystem | plattformunabhängig |
| Programmiersprache | Python |
| Kategorie | Programmbibliothek |
| Lizenz | Matplotlib-Lizenz |
| matplotlib.org | |
Matplotlib ist eine Programmbibliothek für die Programmiersprache Python, die es erlaubt, mathematische Darstellungen aller Art anzufertigen.
Beschreibung
BearbeitenMatplotlib kann mit Python 2.x (bis Matplotlib 2.2.x) und 3.x verwendet werden und funktioniert auf allen gängigen Betriebssystemen. Dabei wird eine Python-ähnliche objektorientierte Schnittstelle verwendet. Nach dem Importieren der Bibliothek kann man graphische Darstellungen mithilfe der Python-Konsole erzeugen. Man kann jedoch auch Matplotlib in bestehende Python-Programme integrieren. Dazu verwendet Matplotlib Anbindungen zu GUI-Bibliotheken wie GTK+, Qt, wxWidgets und Tk. Die Grafiken können in einer Vielzahl von Formaten erstellt werden, z. B.: SVG, PNG, Anti-Grain Geometry, EPS, PDF.
Entwicklung
BearbeitenDie erste Version von Matplotlib wurde von John D. Hunter in den Jahren 2002 und 2003 entwickelt.[3] Gleich zu Beginn war es als freie Open-Source-Bibliothek gedacht. Heute wird die Entwicklung auf GitHub von vielen Personen vorangetrieben.[4]
Beispiele
BearbeitenKurven
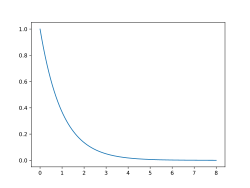
>>> import matplotlib.pyplot as plt
>>> import numpy as np
>>> a = np.linspace(0, 8, 501)
>>> b = np.exp(-a)
>>> plt.plot(a, b)
>>> plt.show()
Histogramm

>>> import matplotlib.pyplot as plt
>>> from numpy.random import normal,rand
>>> x = normal(size=200)
>>> plt.hist(x, bins=30, edgecolor='black')
>>> plt.show()
Streudiagramm

>>> import matplotlib.pyplot as plt
>>> from numpy.random import rand
>>> a = rand(100)
>>> b = rand(100)
>>> plt.scatter(a, b, edgecolor='black')
>>> plt.show()
3D-Plot

>>> from matplotlib import cm
>>> from mpl_toolkits.mplot3d import Axes3D
>>> import matplotlib.pyplot as plt
>>> import numpy as np
>>> fig = plt.figure()
>>> ax = fig.add_subplot(projection='3d')
>>> X = np.arange(-5, 5, 0.25)
>>> Y = np.arange(-5, 5, 0.25)
>>> X, Y = np.meshgrid(X, Y)
>>> R = np.sqrt(X**2 + Y**2)
>>> Z = np.sin(R)
>>> surf = ax.plot_surface(X, Y, Z, rstride=1, cstride=1, cmap=cm.coolwarm, edgecolor='black')
>>> plt.show()
Weitere Beispiele


Weblinks
Bearbeiten- Offizielle Website
- Github-Seite von Matplotlib
- Matplotlib: Lessons from middle age – Video, in dem John D. Hunter die Entwicklung des Projekts beschreibt
- Matplotlib-Anleitung „SciPy Cookbook“ (englisch)
Einzelnachweise
Bearbeiten- ↑ matplotlib.org.
- ↑ Release 3.11.0. 12. Juni 2026 (abgerufen am 12. Juni 2026).
- ↑ John D. Hunter: Matplotlib: A 2D Graphics Environment. In: Computing in Science & Engineering. 9. Jahrgang, Nr. 3, S. 90–95, doi:10.1109/MCSE.2007.55 (englisch).
- ↑ Matplotlib Credits. In: Matplotlib. Matplotlib, abgerufen am 7. August 2014 (englisch).
